


Yarn Evenness Tester
Availability: In Stock
Brand: AdLab
Model: ADL-300
Origin: Europe
- Easy to Use
- Test Standard ASTM D 5647, Q/JG6.72-2002
- High Stability

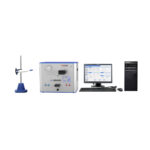
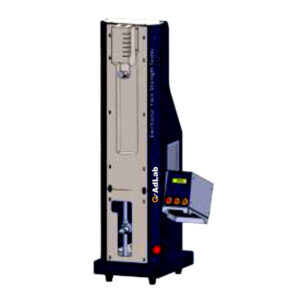
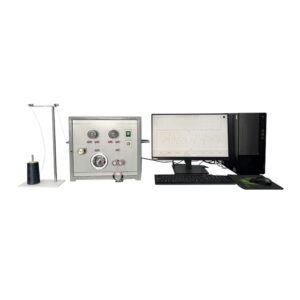
The Yarn Evenness Tester is a universal, high-performance textile laboratory instrument. Specifically, it is used to test the unevenness and hairiness of yarns. It is suitable for pure cotton, wool, silk, linen, and chemical fiber short fibers, as well as spun and blended yarns, making it highly significant for improving and ensuring yarn quality.
Main Features
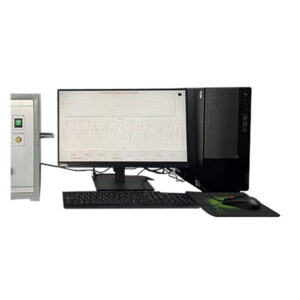
- Data calculation is performed using computer processing, and the monitoring software is based on the Windows platform, featuring a full Chinese graphical interface, good system integration, and high stability. Additionally, it can test CV% value, U% value, H value, SH value, and twelve levels of defects in real time.
- Moreover, it provides various graphical indicators such as variation-length curves, unevenness curves, spectral diagrams, and linear density-frequency distribution diagrams of evenness and hairiness, making it easy to evaluate yarn quality. It also features a fine continuous wave spectrum with 340 channels, which helps users accurately analyze fault locations in the textile process.
- Furthermore, the system includes deviation rate (DR%) values, scatter plots, DR curves, and the relative deviation coefficient ADR (Lc), reflecting the random and uneven structural characteristics of the yarn and aiding in estimating the appearance quality of the fabric surface after weaving. These tools provide new methods for analysis and evaluation.
- The statistical analysis system can generate annual, quarterly, monthly, and daily reports for specific test varieties and provide statistical distribution charts of conventional test indicators, which is helpful for observing medium- and long-term trends. In addition, the expert system assists users in analyzing textile process failures and evaluating spinning quality. Unevenness curves can also be stored for more detailed analysis.
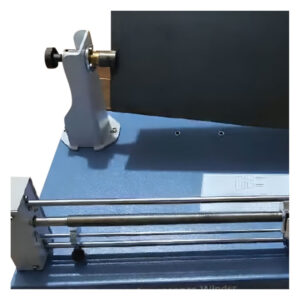
- The electromagnetic tensioner applies tension through software settings, while the transmission system employs servo drive technology for low noise and high reliability. Meanwhile, the top roller automatically expands and contracts, reducing wear and improving yarn stability. The automatic zero adjustment function further enhances testing efficiency and simplifies operation.
Test Standard
ASTM D 5647, Q/JG6.72-2002
Technical Specifications and Parameters
| Yarn count test range | Dry 4tex~80ktex |
| Test speed | 4m/min, 8m/min, 25m/min, 50m/min, 100m/min, 200m/min, 400m/min |
| Test time | Set arbitrarily between 10s and 20min in units of 10 seconds. |
| Coefficient of variation |
|
| Deviation rate (DR%) value DR curve Relative offset coefficient ADR (Lc) |
|
| Defect value |
|
| Spectrogram |
|
| Line Density Frequency Distribution Plot | It can provide two linear density frequency distribution diagrams ranging from -100% to +100% and exceeding +100%. |
| Line Density Frequency
Distribution Plot |
|
| Statistical distribution chart |
|
| Hairiness test index |
|
Why Choose the Yarn Evenness Tester?
The Yarn Evenness Tester is vital for textile manufacturers and labs aiming to enhance yarn quality. Since unevenness and hairiness impact fabric performance, this tester delivers accurate results to improve production processes. It supports a wide range of yarn types, ensuring versatility, while its expert system and graphical tools aid in fault analysis. This leads to better cloth surface quality and compliance with industry expectations. For more details or to request a demo, contact our team today.


Reviews
There are no reviews yet.